Excel - Power Query
It's possible to load data directly from Optimeering's API into Excel using Power Query. This guide shows some of the basics to getting started.
Note
This guide assumes you are using the desktop version of Excel on a Windows machine
Goal
Our Goal is to:
- Load the
Imbalance,PT15M, prediction series from the API - Use the
series_idfor theImbalance,Price_Spread,Quantiles,NO3series to load the latest prediction event
Step 1 - Obtaining an API Key
See the Obtaining an API Key docs to retrieve an API Key. This will be needed when we try to query the API from Excel.
Step 2 - Setting Up Our Credentials
Open up a new workbook in Excel.
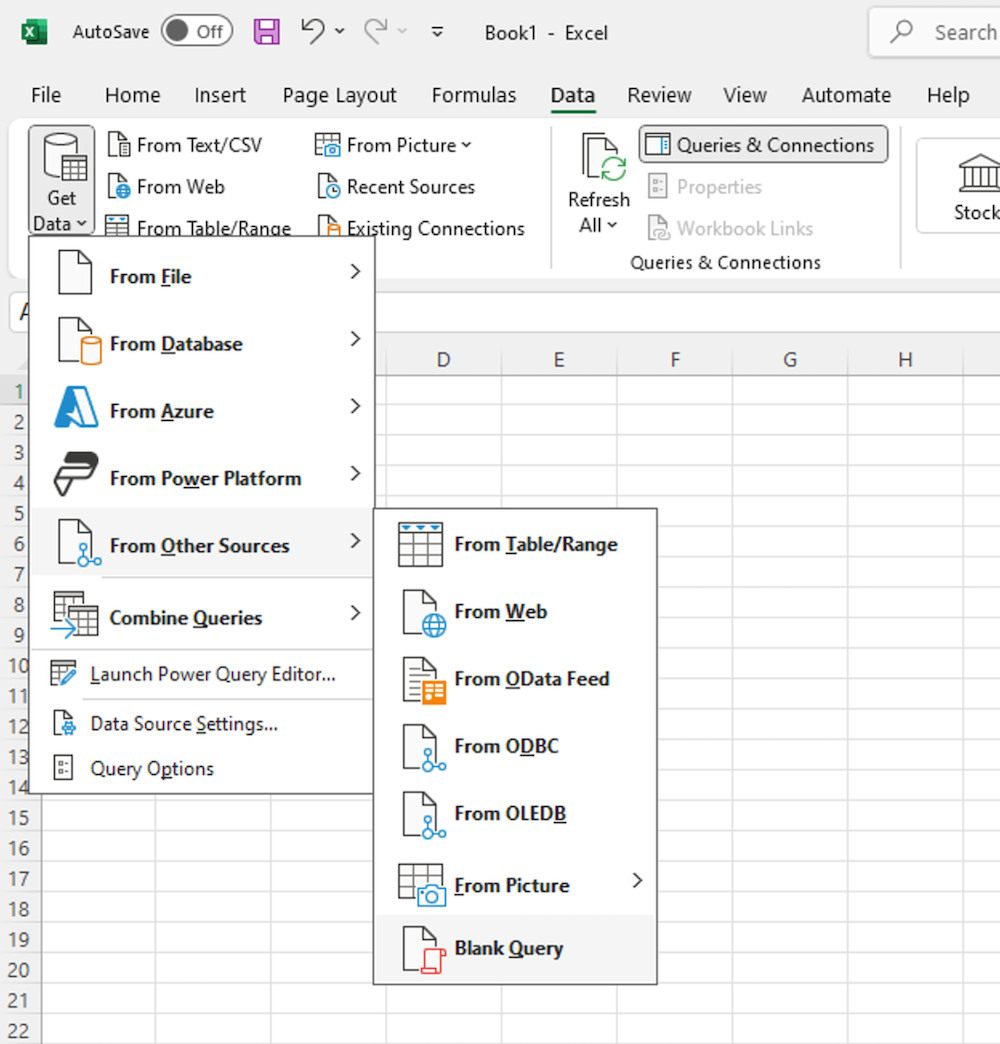
Go to the Data tab and then click on the Get Data button. Under From Other Sources select Blank Query as shown below:
We want to store our API Key in a Parameter. With the Home tab selected click on Manage Parameters. Click new and then change the Name to API_KEY. Under Current Value paste in your API Key from the previous step. See the video below:
Step 3 - Query the Predictions Series API
In order to later query for Prediction Events we need the ids of the series. We can retrieve those from the app.optimeering.com/api/predictions/series endpoint.
- Right click on the blank
Query1in the Queries sidebar and then select Rename. Call itSeries - On the Home tab click on Advanced Editor
- To authenticate our request we need to set some request headers. Replace
Source = ""on the second line with the following:#"apikey"is the name of the header used to pass in the API Key, andAPI_KEYrefers to the parameter we set in the previous step - On the next line, define the
Urlwe will use to query the API: - Then make a web request with the following:
The
Web.Contentstakes in a Url, and some request options. The only Option we want to set is theHeaders, which we set to theHeadersdefined earlier. - Our response is going to be in Json format, we can convert it using the built in functions:
- Finally, update the returned value to be
JsonContent. The final query should look like this: - Click on Done down the bottom of the editor. This will return you to the Power Query Editor window.
-
You should see an error like the following:

Click on Edit Credentials, ensure Anonymous is selected and click Connect
At this point you should see a Record, with a single key items and a value that is a List, as shown below:
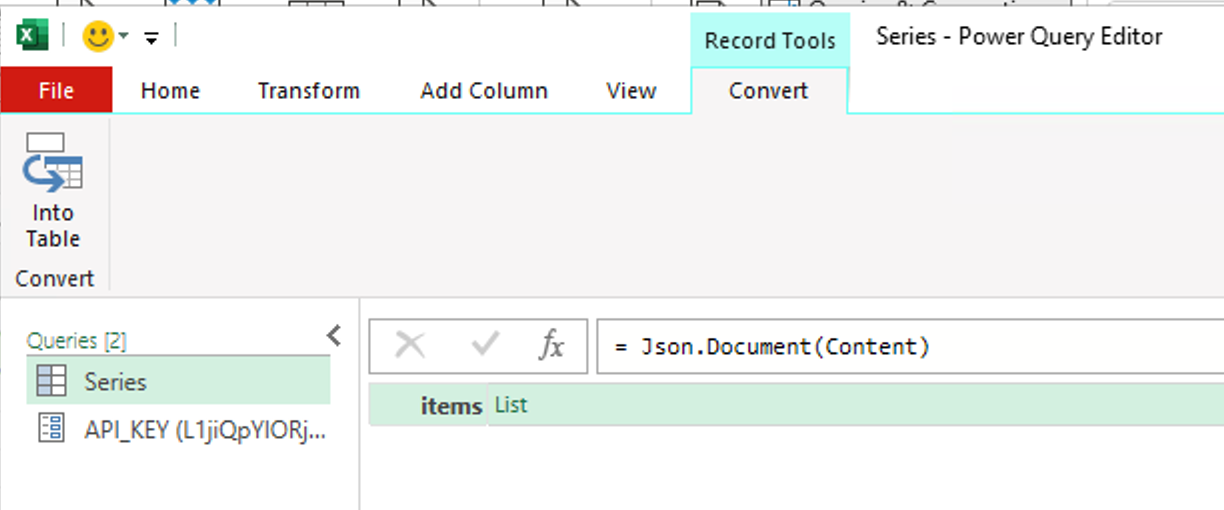
Congratulations, you have made your first request to the Optimeering API from Excel!
Step 4 - Expanding the Response
In this step we will transform the current record into a table with all our series as rows, and their properties as columns.
- Make sure that the
Seriesquery is selected on the left hand side, andJsonContentis selected on the APPLIED STEPS on the right hand side under Query Settings. If you can't see Query Settings go to the View tab and click Query Settings - Click on
Listto load theitems. You should now see a new List, with each value in the list being a newRecord -
You should see a tab called Transform under List Tools. Click on this and then on the To Table button, and then click Ok. This converts the record into a Excel table, which makes the next step easier. This is usually a good step when you have a
ListofRecords.Now you will see an Expand button on the right hand side of the Column header. Click this. You will now see the properties of our Prediction Series. You can deselect
created_at,latest_event_timeandversion.Also deselect
Use original column name as prefix.Click Ok to expand all the records in the table into new columns.
The video below shows these steps.
-
Finally, on the Home tab click Close & Load. You will now see all our Prediction Series as a table in your workbook
Step 5 - Load the Prediction Events
Before we get started with our next query, we need to make a Privacy Level change to our current workbook. Excel is very strict on sharing data between requests. Since we are only querying the Optimeering API, there is no danager here, so it's easiest, and more efficient, to disable this setting.
- On the Data tab click on Get Data and then on Query Options at the bottom
- Click on Privacy on the left menu
-
Toggle
Ignore the Privacy Levels and potentially improve performance
Now we are ready to create another Query. Since we are going to use the same Web Options in another query, we should move these into a query themselves.
- On the Data tab click on Queries & Connections
- On the Queries & Connections pane, double click
Seriesto re open the Power Query Editor - On the Queries pane, right click and select
New Query > Other Sources > Blank Query - Rename this
WebOptions - Open the Advanced Editor and enter the following:
- Click Done
- Select the
Seriesquery and then open the Advanced Editor - Remove the
Headersstep, and then update theContentstep to reference our newWebContentsquery. - Click Done and check the data still loads by clicking Refresh Preview button on the Home tab
We are now ready to make another API call.
- Right click on the
Seriesquery and click Reference - Rename the new Query to
Data -
Apply filters to each column until we have:
- product =
Imbalance - resolution =
PT15M - area =
NO3 - unit_type =
Price_Spread - statistic =
Quantile
You should see a single row now in our table.
See the video for details:
- product =
-
Open up the Advanced Editor, add a comma at the end of the
#"Filtered Rows"step and then add a new line below - Add the following step:
This takes the first colum, first row value, which is the
series_id, and converts it from a number to text - Define the Url for getting the latest Prediction Event as follows:
- Query the API, and convert the Json response:
- Update the returned value to
JsonContentand click Done. You should once again see a single Record with a keyitemsand a value ofList - Click on
List, thenRecord, and thenListon theeventskey - Now convert the List of a single Record into a Table, by going to the Transform tab and clicking To Table
- Expand the Column, deselect
created_atandis_simulatedandUse original column name as prefix - Expand the
predictionscolumn, select Expand to New Rows - Expand the
predictionscolumn again, keeping all the new columns - Expand the
valuecolumn, keeping all the new columns, to see the quantile data - Finally, right click on the
event_timeandprediction_forcolumns, under Change Type select Date/Time
Click on Close & Load to load the data into a table on a new sheet. We now have the latest Imbalance Price Spread Quantiles for NO3 predictions!
Step 6 - Refreshing the Data
Now that we have the Queries and Connections all defined, and data in our workbook, we can update the data by going to the Data tab and clicking the Refresh All button. Another useful option if you are leaving the workbook open is to set the Data Query to automatically refresh. To do this:
- From the Data tab click on Queries & Connections
- Right click on the
Dataquery and go to Properties - Select Refresh every x minutes`, setting the minutes to the value you want (such as 1min). Alternatively you can se it to automatically refresh when opening the workbook by selecting Refresh data when opening the file
Now you should have the basics to start building the workbooks and interfaces you need to consume Optimeerings Predictions in Excel. If you have any questions or suggestions remember you can reach out to us at https://help.optimeering.com.